In case you want to explain some central aspects of quantum information theory to curious people (like to explain aspects of the recent Nobel Prize in physics), some visualizations in my free online book might help you out.
In 2018 I launched my “free online online book for curious people” www.quantencomputer-info.de .
I think, one of the main challenges for explaining quantum computing to laymen is to visualize central aspects in quantum theory. Of course, the Bloch sphere explains a qubit perfectly. But in my opinion it needs too much further explanation in order to be applicable for this purpose. Plus, the Bloch sphere lacks visualizing multiple-qubit states.
So instead of the Bloch sphere, for my online book, I have decided to use simple arrow diagrams. On the one hand these “brutally” downgrade the complex Hilbert space to ordinary real Euclidean space, but on the other hand I think, they have some nice advantages like explaining
-
-
- Hilbert space as a vector space
- Amplitudes and probabilities
- Unitaries as rotations
- Provide intuition for multi-qubit states
-
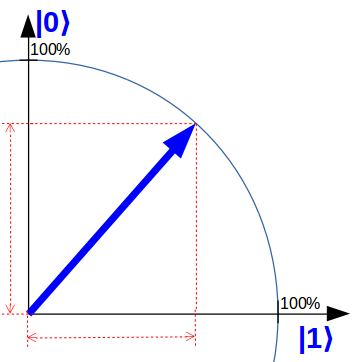 A qubit as a uniform superposition of the states 0 and 1 in the simplified visualization. The amplitudes of the two states are the red dashed lines at each axis. A measurement „collapses“ / rotates the arrow on one of the axis. The amplitudes / red dashed lines are indicators of the probability that this will happen.
In this picture a H-gate is a simple rotation by 45° degrees:
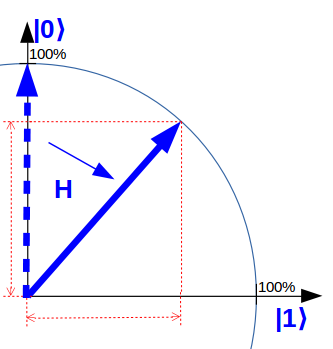
A H-gate transforms the state 0 into the uniform superposition of 0 and 1.
And the X-gate is a simple reflection on just this uniform superposition:
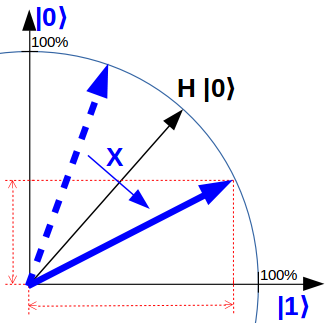
An X-gate is a reflection on the uniform superposition.
This, by the way, also demonstrates that H maps the computational basis to eigenstates of the X-gate with eigenvalues +1 and -1.
Once you have established this simplified picture you can visualize the measurement in different bases (like for the uncertainty relation):
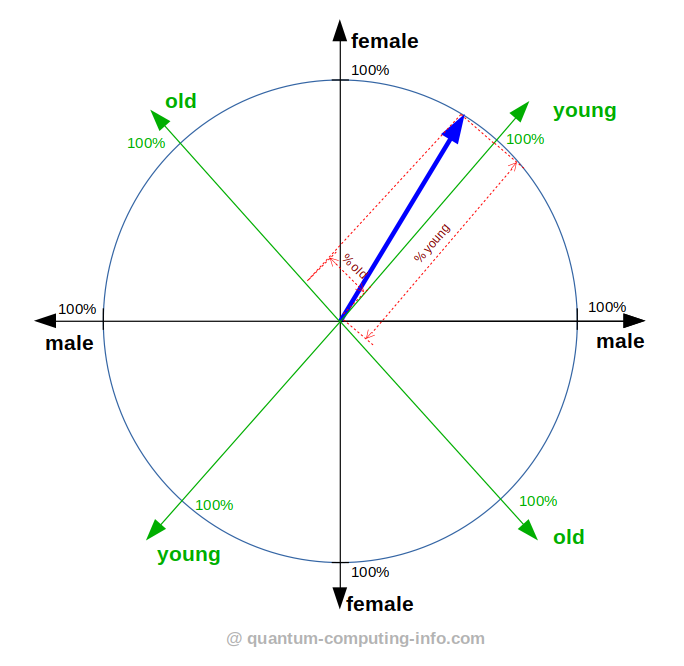
Uncertainty relation: Measuring the qubit in the property / observable „gender“ requires a totally different perspective / basis as measuring the property / observable „age“. Measuring one property for sure, collapses the arrow to the corresponding axis and makes the other property completely unknown.
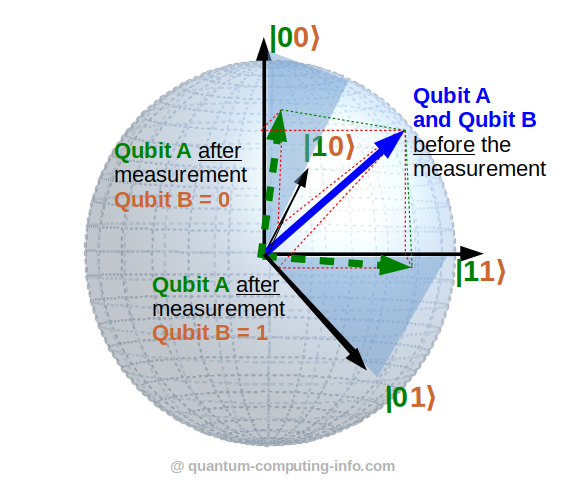
What I find especially handy: In the simplified picture you can even visualize entanglement – sort of. OK, we would actually need 4 dimensions for this, but we can give it a try on a flat screen using some perspective tricks:
Entanglement: Measuring the 2-qubit-state on the brown qubit B collapses the blue arrow to the green dashed arrows of qubit A. If we measure 0 for qubit B we get the green dashed arrow in the left 2d-plane which mainly points in the green 0 direction. On contrary, measuring 1 for qubit B we get the green dashed arrow in the bottom 2d-plane which mainly points in the green 1 direction.
The above picture shows an entangled state which is not maximally entangled (unlike Bell pairs). I find this example more appealing, as it implies that a measurement on qubit B leaves / keeps an uncollapsed quantum state / arrow for the other qubit which is generally still a superposition of 0 and 1 (again, unlike Bell pairs).